Party Planning with Probability
Use probability and simulations to estimate the number of guests that will attend your event!
Introduction
My partner recently tasked me with coming up with the guest list for our wedding. Coming up with the list was easy - but how many people could we expect to actually attend? We needed a number to give to the various vendors catering our wedding so, as a bonafide nerd, I turned to probability and simulation for the answer. The idea was to assign a “probability of attendance” for each guest on my list, treat each guest’s attendance as a Bernoulli random variable, and run simulations to determine how many guests we might expect to attend the wedding.
To this end, I whipped up a very simple Python package called pyguest which you can install with:
$ pip install pyguest
An Example
Let’s walk through a quick example of how the package works. Below is the python code to create a hypothetical guest list, with each guest assigned a “probability of attending”.
import math
import numpy as np
import pandas as pd
pd.options.plotting.backend = "plotly"
np.random.seed(123)
guest = [f"Guest {i}" for i in range(1, 101)]
proba = np.random.randint(5, 11, 100) / 10
df = pd.DataFrame(proba, index=guest, columns=['Probability of Attending'])
df.head(8)
| Probability of Attending | |
|---|---|
| Guest 1 | 1.0 |
| Guest 2 | 0.7 |
| Guest 3 | 0.9 |
| Guest 4 | 0.7 |
| Guest 5 | 0.6 |
| Guest 6 | 0.8 |
| Guest 7 | 0.7 |
| Guest 8 | 0.8 |
We can use pyguest to simulate wedding attendance from this guest list. The idea is to treat each guest’s attendance as a Bernoulli random variable. For each simulation, we run through all the guests in the list and record how many “successes” we have (i.e, how many guests attend the wedding based on their respective probabilities). I’ve coded this up in pure NumPy and it’s nice and fast - ten thousand simulations can be run in literally the blink of an eye. Here’s the code to do it:
from pyguest import simulate

results = simulate(df['Probability of Attending'], simulations=10000)
print(f"Results shape: {results.shape}")
print(f"First 5 results: {results[:5]}")
Results shape: (10000,)
First 5 results: [69 78 73 78 78]
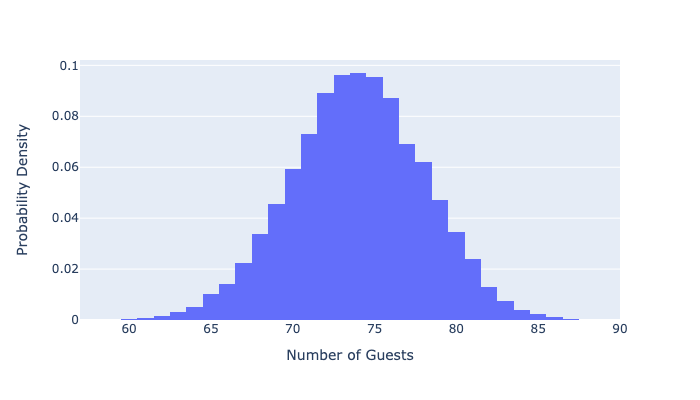
The results variable is an array containing the total number of attending guests in each of the 10,000 simulations. We can plot these results to help us understand how many of our 100 hypothetical guests will actually be attending the wedding.
fig = pd.DataFrame(results).plot.hist(histnorm='probability density', width=700, height=400)
fig.update_xaxes(title_text='Number of Guests')
fig.update_yaxes(title_text='Probability of Attending')
fig.update_layout(showlegend=False,
                  xaxis = dict(range=[57,90], tickmode = 'linear', tick0 = 55, dtick = 5))
Summary
There you have it! We originally had a hypothetical guest list of 100 people, each with an allocated “probability of attendance”. After running 10,000 simulations, we get a distribution of expected guest attenendance and can use this distribution to inform our future planning - want to be conservative? Plan for 85 guests. Want to live a little riskier? You might be able to get away with planning for 75 guests. Obviously the simulation results depend on the probabilites you assign to each guest so use your best judgement!